At Diabetes UK, tackling inequity is a key driver in achieving our vision of a world where diabetes can do no harm.
To achieve this ambition, we have also committed to continuing to tackle inequality in our own charity, by being an inclusive and diverse organisation, with equity at its heart.
Measuring progress is a key part of making change happen, and every year we’re required by the government to report our charity’s gender pay gap.
As part of our commitment to equity, diversity and inclusion (EDI), we have also proactively chosen to calculate and publish our ethnicity pay gap using the recommended government methodology.
We know that many factors beyond gender and ethnicity shape our experiences at work, and reporting on pay is one measure among many.
You can read more about what we are doing to become a more diverse and inclusive organisation in our Tackling Inequity Strategy (PDF, 38,485KB) and EDI 5-year Action Plan, Diabetes UK Equity, Diversity and Inclusion 5-Year Action Plan: Colleagues and Volunteers (PDF, 1,539KB).
Pay gaps
A pay gap refers to the difference between the average pay of two groups of people. This gap can result for a range of reasons such as occupational segregation (being more likely to be in specific roles), barriers to career progression, broader social factors and discrimination.
A pay gap does not mean that one colleague is paid more than another doing the same job.
The pay gap reports also include information about the representation of colleagues of different backgrounds and genders at different levels of the charity. This is because the level of representation in higher paid roles is a key driver of pay gaps. It also helps us to track our progress towards becoming a charity that fully represents the diversity of the communities we serve.
You can read the full details of our most recent analysis, Gender and Ethnicity Pay Gap Reporting 2025 (PDF, 2.3MB)
Ethnicity
To protect colleague privacy, the data shared below compares the pay and representation of White colleagues to an amalgamated category of colleagues from Asian, Black and Mixed or multiple ethnicity backgrounds.
We complete more in-depth reporting for internal use to inform our equality, diversity and inclusion work and the actions we will take following this analysis.
You can read the figures for this year and compare to previous years below:
Gender
2025
Our gender pay gap information for 2025
Our gender pay gap is based on a snapshot of the pay for all our relevant employees in April 2025.
Women’s hourly rate is
4% 0%
lower lower
(mean) (median)
Pay quartiles
How many men and women are in each quartile of the charity’s payroll.
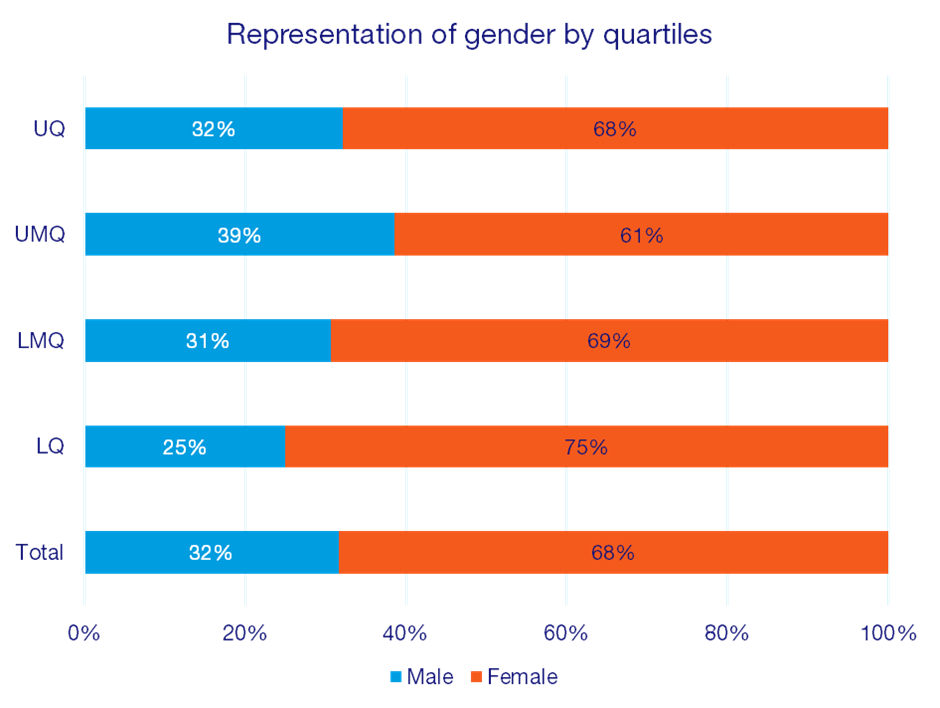
Upper quartile:
Upper middle quartile:
Lower middle quartile:
Lower quartile:
Total: |
2024
Our gender pay gap information for 2024
Our gender pay gap is based on a snapshot of the pay for all our relevant employees in April 2024, as well as bonuses paid between April 2023 and April 2024.
Women’s hourly rate is
7% 0%
lower lower
(mean) (median)
Who received bonus pay
11% 17%
Men Women
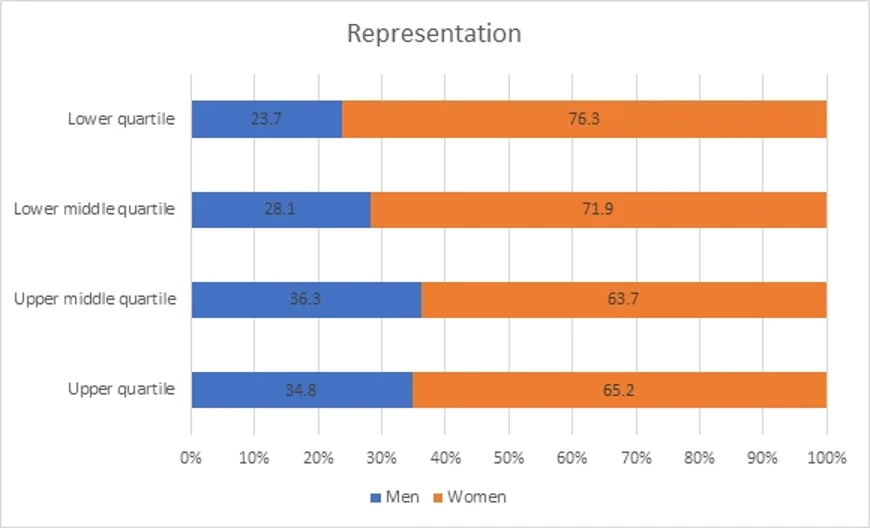
Pay quartiles
How many men and women are in each quartile of the charity’s payroll.

2023
Our gender pay gap information for 2023
Our gender pay gap is based on a snapshot of the pay for all our relevant employees in April 2023, as well as bonuses paid between April 2022 and April 2023.
Women’s hourly rate is
8.8% 0%
lower lower
(mean) (median)
Women’s bonus pay is
9.7% 0%
higher lower
(mean) (median)
Who received bonus pay
15.8% 11.5%
Men Women
Pay quartiles
How many men and women are in each quartile of the charity’s payroll.
2022
Our gender pay gap information for 2022
Our gender pay gap is based on a snapshot of the pay for all our relevant employees on 31 March 2022, as well as bonuses that were paid between 1 April 2021 and 31 March 2022.
Women’s hourly rate is
8.51% 1.96%
lower lower
(mean) (median)
Women’s bonus pay is
10.87% 0%
lower lower
(mean) (median)
Who received bonus pay
8.82% 8.61%
Men Women
Pay quartiles
How many men and women are in each quarter of the employee’s payroll.
Upper quartile
41% 59%
Men Women
Upper middle quartile
35.64% 64.36%
Men Women
Lower middle quartile
28.71% 71.29%
Men Women
Lower quartile
29.7% 70.3%
Men Women
2021
Our gender pay gap is based on a snapshot of the pay for all our relevant employees on 31 March 2021, as well as bonuses that were paid between 1 April 2020 and 31 March 2021.
Women’s hourly rate is
9.78% 0.21%
lower lower
(mean) (median)
Women’s bonus pay is
-0.41% 0%
lower lower
(mean) (median)
Who received bonus pay
12.50% 13.75%
Men Women
Pay quartiles
How many men and women are in each quarter of the employee’s payroll.
Upper quartile
38.38% 61.62%
Men Women
Upper middle quartile
34.34% 65.66%
Men Women
Lower middle quartile
27.27% 72.73%
Men Women
Lower quartile
28.00% 72.00%
Men Women
2020
Our gender pay gap is based on a snapshot of the pay for all our relevant employees on 31 March 2020, as well as bonuses that were paid between 1 April 2019 and 31 March 2020.
Women’s hourly rate is
9.45% 1.96%
lower lower
(mean) (median)
Women’s bonus pay is
-5.72% 0%
lower lower
(mean) (median)
Who received bonus pay
16.00% 21.01%
Men Women
Pay quartiles
How many men and women are in each quarter of the employee’s payroll.
Upper quartile
39.00% 61.00%
Men Women
Upper middle quartile
32.00% 68.00%
Men Women
Lower middle quartile
27.00% 73.00%
Men Women
Lower quartile
26.73% 73.27%
Men Women
2018
Our gender pay gap is based on a snapshot of the pay for all our relevant employees on 31 March 2018, as well as bonuses that were paid between 1 April 2017 and 31 March 2018.
Women’s hourly rate is
12.16% 8.19%
lower lower
(mean) (median)
Women’s bonus pay is
1.11% 0%
lower lower
(mean) (median)
Who received bonus pay
18.87% 22.61%
Men Women
Pay quartiles
How many men and women are in each quarter of the employee’s payroll.
Upper quartile
39.56% 60.44%
Men Women
Upper middle quartile
33.70% 66.30%
Men Women
Lower middle quartile
26.09% 73.91%
Men Women
Lower quartile
16.30% 83.70%
Men Women
Ethnicity
2025
Our ethnicity pay gap information for 2025
Our ethnicity pay gap is based on a snapshot of the pay for all our relevant employees in April 2025.
The hourly rate of colleagues from Black, Asian and Mixed or Multiple ethnicity backgrounds is:
12% 17%
lower lower
(mean) (median)
Pay quartiles
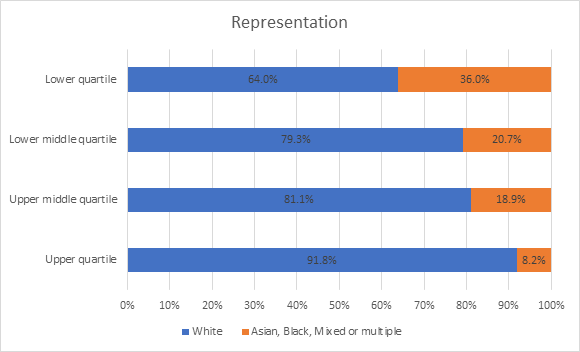
How many colleagues from different ethnic backgrounds are in each quartile of the charity’s payroll:
Upper quartile:
Upper middle quartile:
Lower middle quartile:
Lower quartile
Total: |
2024
Our ethnicity pay gap information for 2024
Our ethnicity pay gap is based on a snapshot of the pay for all our relevant employees in April 2024.
The hourly rate of colleagues from Black, Asian and Mixed or Multiple ethnicity backgrounds is:
9% 0%
lower lower
(mean) (median)
This group’s bonus pay is
2% 0%
lower lower
(mean) (median)
Who received bonus pay
Colleagues from White backgrounds: 16%
Colleagues from Asian, Black and Mixed or multiple ethnicity backgrounds: 8%
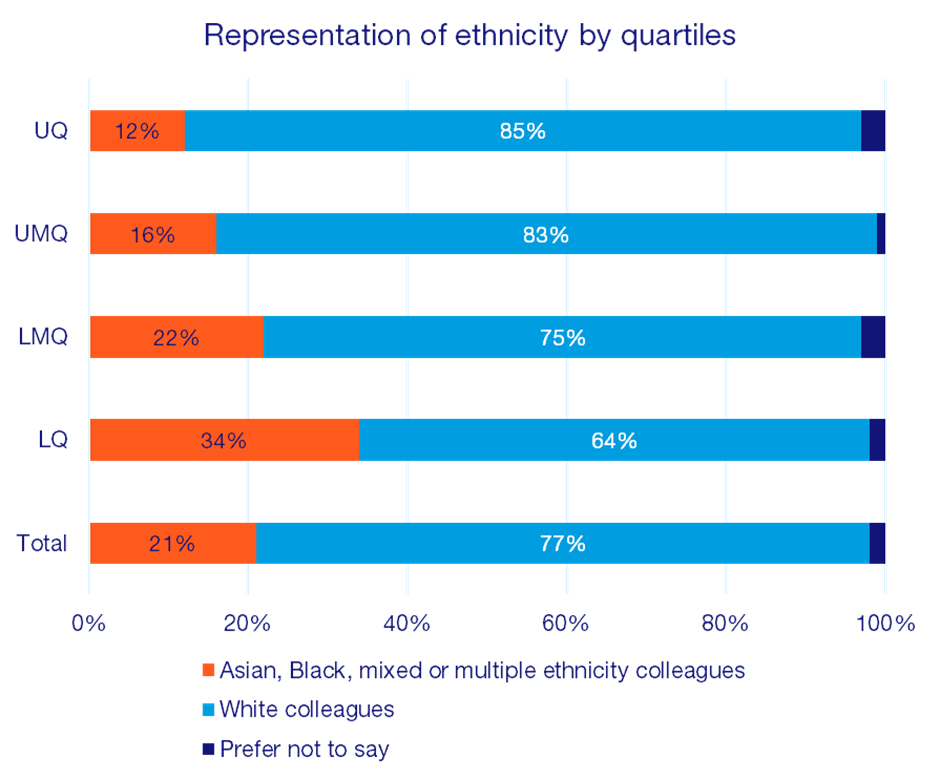
Pay quartiles
How many colleagues from different ethnic backgrounds are in each quartile of the charity’s payroll:

2023
Our ethnicity pay gap information for 2023
Please note this is the first year we’ve followed a consistent format when calculating this reporting, so there is no available comparison data for previous years.
The hourly rate of colleagues from Black, Asian and Mixed or Multiple ethnicity backgrounds is:
9.2% 0%
lower lower
(mean) (median)
This group’s bonus pay is
11% 0%
lower lower
(mean) (median)
Who received bonus pay
Colleagues from White backgrounds: 14.6%
Colleagues from Asian, Black and Mixed or multiple ethnicity backgrounds: 8.6%
Pay quartiles
How many colleagues from different ethnic backgrounds are in each quartile of the charity’s payroll: